A science can be defined as knowledge about or study of the natural world based on facts learned through experiments and observation.
Part of what we do for our clients is to support them in the management of their online presence whether through online campaigns, digital strategy, customer experience or social media strategy. Giving the growing number of people using our clients social media platforms it became obvious that a series of tactics is not enough to manage their community. In fact on a given period of time such as christmas, valentine day etc we could then run ads to drive sales or leads but we struggle to keep the momentum. Moreover what is the actual value of a like, or a share business wise? What is the context or intent of someone sharing the latest infographics published online? Can we replicate the success of a given halloween post?
To answer all these questions and to sustain the success on SM we started a series of experiments with our team of data scientists, community managers and strategists. Below are some of the experiments runs:
When is your audience online?
This question is easy to answer. Basically the idea is to turn to Google Analytics or facebook analytics for instance to look at which period your fans are interacting with your content. It sounds casual but it is not. Most the CM teams can not share a clear answer on the following question : What is the best time to post on SM?
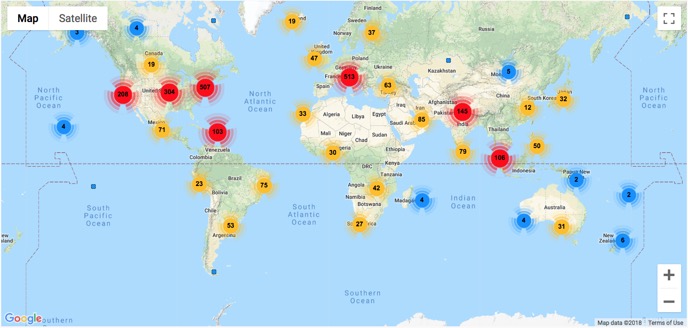
Where is your audience?
Most of the SNS tools include location features that helps to have a knowledge of your followers location. Be aware that most of the time only a sample of the data is shown, leading to some points being map incorrectly. However, this doesn’t have to prevent the CM’s motivation to understand where exactly is living her audience. Some semantic analysis on the follower’s biography have proven to give some additional hints.
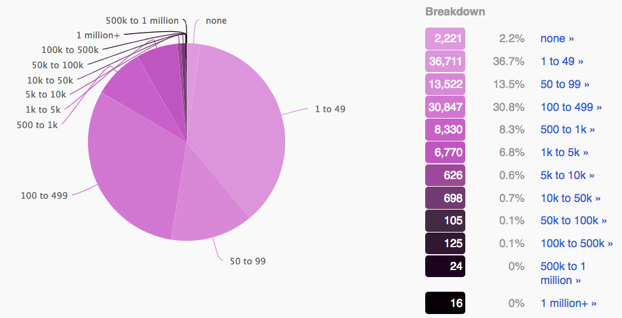
What is the quality of my following base
The quality of the following base refers to the sum of the followers of your own followers. It will help you know the top profiles with whom you need to engage. Top profiles followers such as influencers will have a bigger impact when they engage with your post, as their followers will be the first to know it. We have seen exceptional results by analysing all the reactions and comments on content becoming viral.
When a person sees their friend likes your business — your ads drive, on average, 50% more recall and 35% higher online sales lift.”
How algorithm works?
With the increasing number of organic content published the competition between organic posts to have a spot in people’s news feed is higher than ever, and today’s algorithms are designed to pick the most relevant ones according to each specific profile. This is important because on Facebook for instance in general organic post are exposed to less than 5% of your audience. This makes advertising mandatory on platform
Case Study : Is there a relationship between budget and performances on Social Media?
The Twitter analysis illustrated below is a segment from a larger study which involved performing correlation testing on many different metrics from several different social media platforms such as; Facebook, Twitter, Instagram, and LinkedIn. Several examples of positive correlation1 were identified during this analysis.
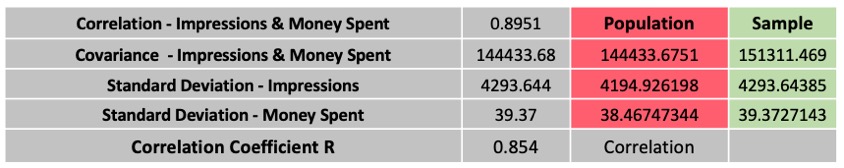
The correlation coefficient R = 0.854 indicates a strong positive linear relationship between impressions, and money spent which suggests that as more money is spent on campaigns, it will result in more impressions. It’s beneficial for social media teams to be aware of this relationship as it enables us to control the amount of impressions a campaign receives by changing the independent variable (Money Spent).
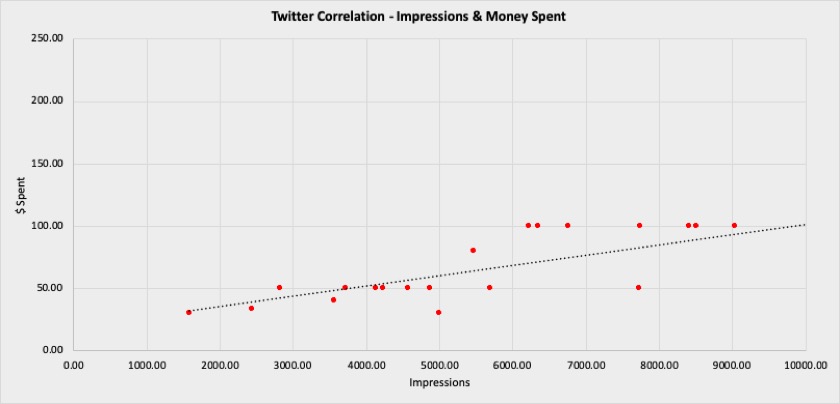
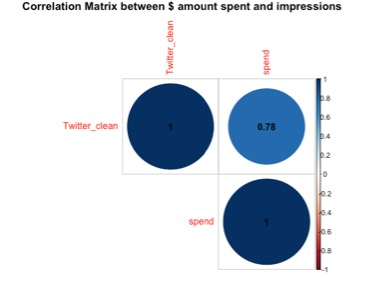
The correlation matrix shows that there is a strong positive linear relationship between the budget spent on ads and the number of impressions on ads. Twitter’s algorithm increases the exposure of an ad according to the budget spent.
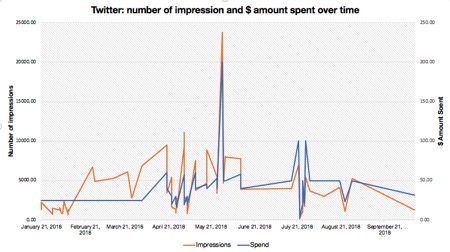
The line chart shows the correlation graphically. When one variable moves, the other one moves in the same direction.
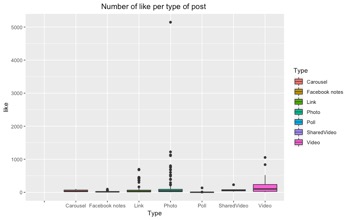
On this box plot we can see that one photo attracted +5K likes, which is unusual. In statistics, this is called an “outlier”.
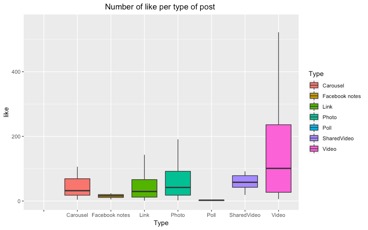
By removing the outliers, the box plot becomes easier to read and gives a rich set of information. Here we can notice that video contents received more likes compared to other type of post with 25% of all the videos receiving between 230 and 520 likes. However, the data are more dispersed than the other type of post, implying that several factors could impact the success of a video post.
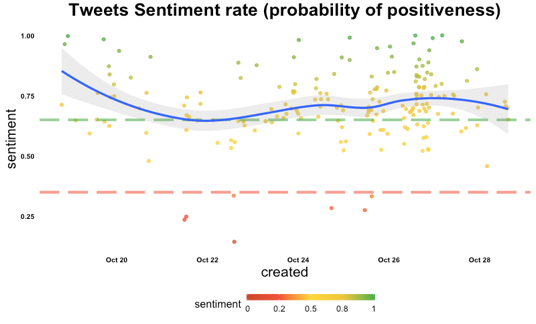
(code of this algorithm inspired by https://analyzecore.com/2017/02/08/twitter-sentiment-analysis-doc2vec/)
Machine learning algorithms allow to know the tweets sentiment rate of all the posts mentioning a brand name. Overall the tweets were classified as positive as the average blue line is plotted above the green line representing 70% of “positivity”.
The path to a testing model : Let’s try to build a model:
- Segments to learn more about your audience
- Use stats to identify patterns
- Budget Forecast principles and example of improvements
There are different approaches that analysts can use when building a forecasting model for a budget. Different forecasting models have distinctive requirements in order for them to be built properly, such as significant amounts of historical data, or an analyst with strong mathematical abilities.
Here at Valtech we use two different approaches while building a forecasting model for a budget.
The method we use the majority of the time involves having access to a significant amount of historical data, discovering trends, and projecting those trends into the new budget. An alternative approach involves creating the forecasted budget by forecasting the amount of money needed for each individual event, and summing them to achieve the total budget. The second approach is less mathematical and should be used in situations where historical data is not available, or when working on a client project where budgets are somewhat known.
This is the last part of this series of articles on Community management as a science. We tried to share our thinking, tools and approach in order to make social media campaigns successful. One of the key learning of our journey is that marketer should change their mindset regarding community management and add new skills in the social media teams in order to run a lot of tests.
—
1 Positive correlation is a relationship between two variables in which both variables move in tandem—that is, in the same direction. A positive correlation exists when one variable decreases as the other variable decreases, or one variable increases while the other increases.