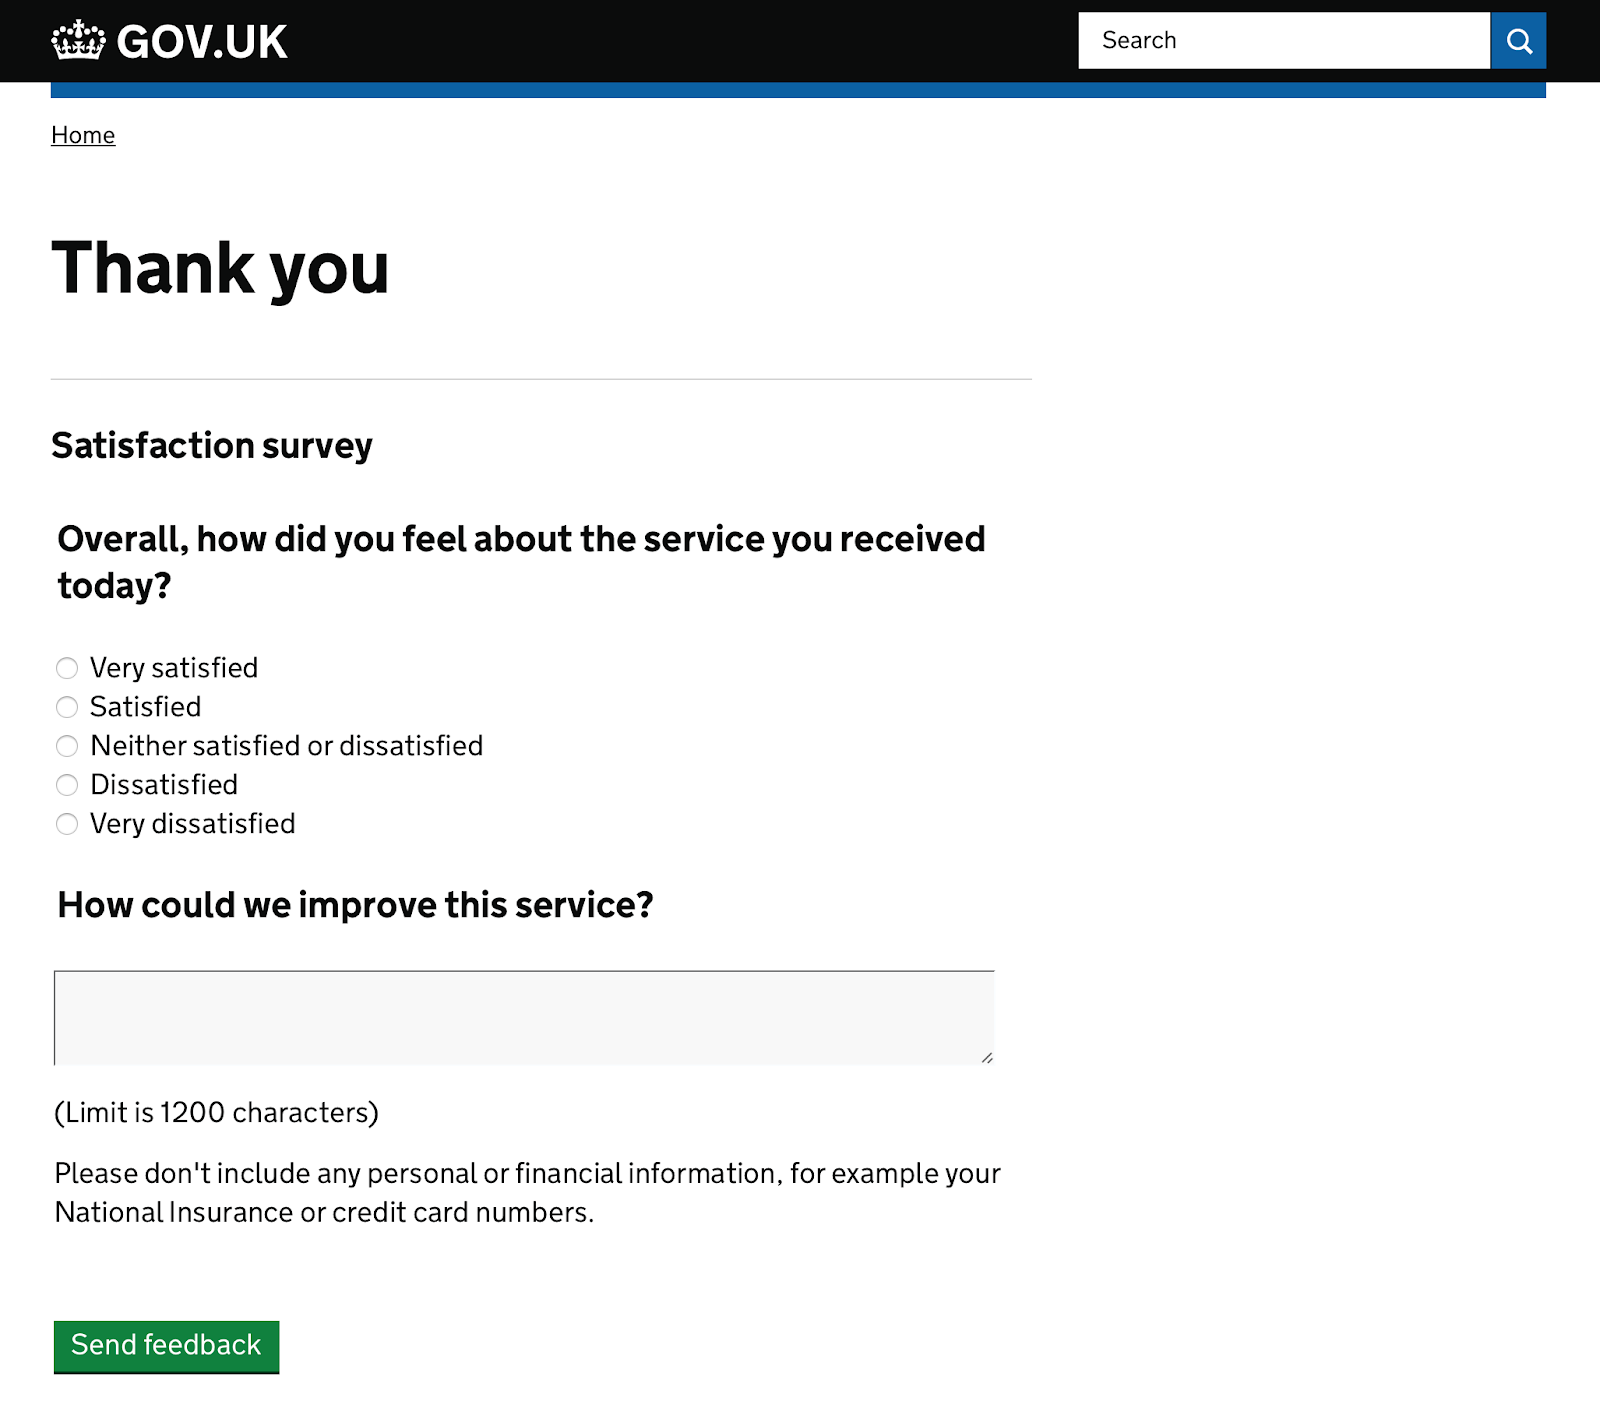
The “Done” page is linked off from your final confirmation page. It consists of two questions "Overall, how did you feel about the service you received today?” and "How could we improve this service?”. From the first question, you can calculate your “Satisfaction score”, which is important to monitor how well your service is performing. The second question is more difficult to quantify, it’s a free text box with a 1200 character limit.
The problem
Free text is notoriously tricky to analyse. People can literally type anything in that box (and they will!). At the moment, the way to access this data is through the GOV.UK “Feedback explorer”. Somebody with access to this can export the data into a CSV file. At the start of our project, when we were in “private beta” we were able to manually scan the data in here. As the user base was quite small, this was relatively pain-free to do.
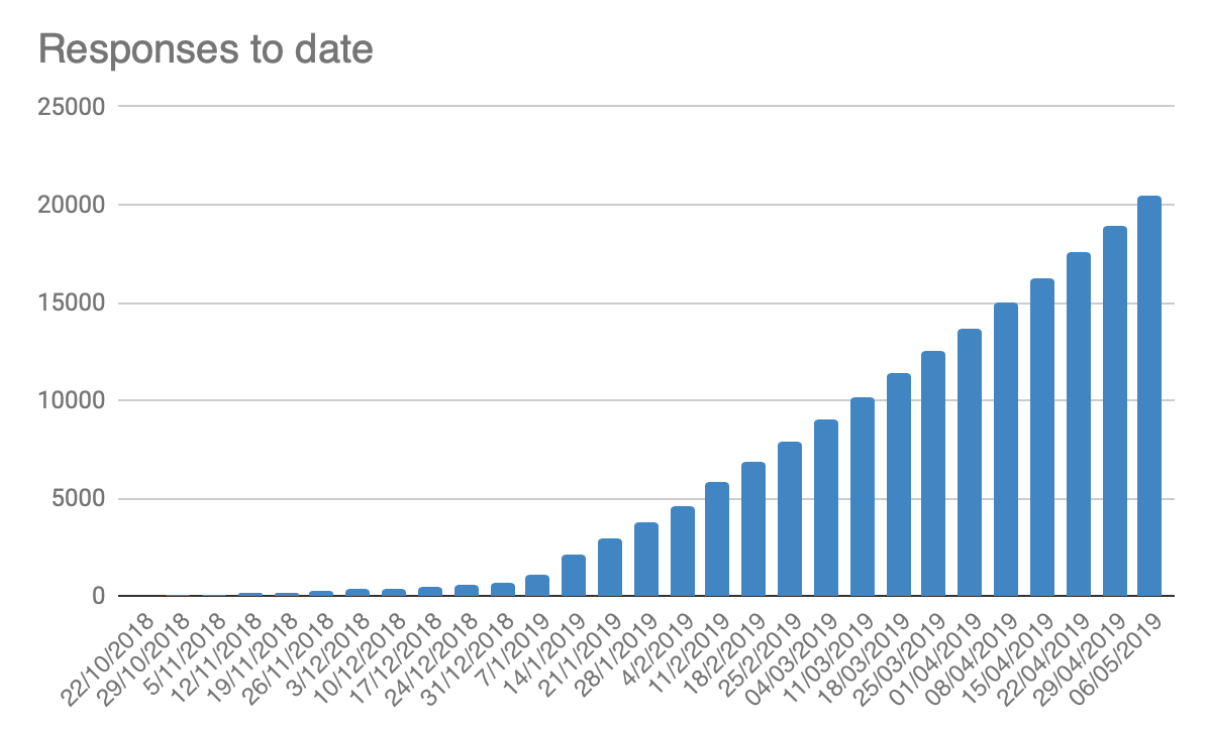
Our process was to go through each submission and assign it to a theme. We’d then quantify how many people were submitting feedback with a particular theme and then play this back to the team. We’d do a playback with a “leaderboard” of responses along with quotes for the team to read. As the weeks passed, we started opening the service up to more users. In December we opened it up to all local authorities and we quickly realised that we’d need a new approach. We’re now averaging 1,500 responses a week. To date (10 May 2019) there’s been over 20,000 responses.
On the Blue Badge service, we use online collaboration tools for everything. Our colleagues at DfT are based in Swansea. Our delivery team is based in Manchester and we have consultants that travel up from London and Birmingham. Not to mention the 206 local authorities, which are by definition, spread across the UK. Across the project, we use Zoom.us, JIRA, Confluence and Slack. For our bi-weekly show & tells we broadcast our Google Slides presentations using YouTube Live. So it made sense to bring our feedback exports into Google Sheets. This way we could have a central place to view feedback and calculate our satisfaction score.
Click here for 'Giving your users a voice Part 2'