


Oh wait, you were looking at the log file on the wrong server.
Now that I’ve forced you to relive that horror, let us look at a different way of going about things. Microsoft’s Application Insights isn’t really new to the scene, but Sitecore has taken big leaps with version 8.2 update 1+ to make sure integration with Application Insights is super-tight. The Sitecore PaaS offering in Azure can’t support the local log files and performance counters on those app services so instead things need to be streamed to Application Insights. While that makes PaaS pretty awesome right away, we can steal all those goodies for any other Sitecore instance too.
What does Sitecore send to Application Insights?
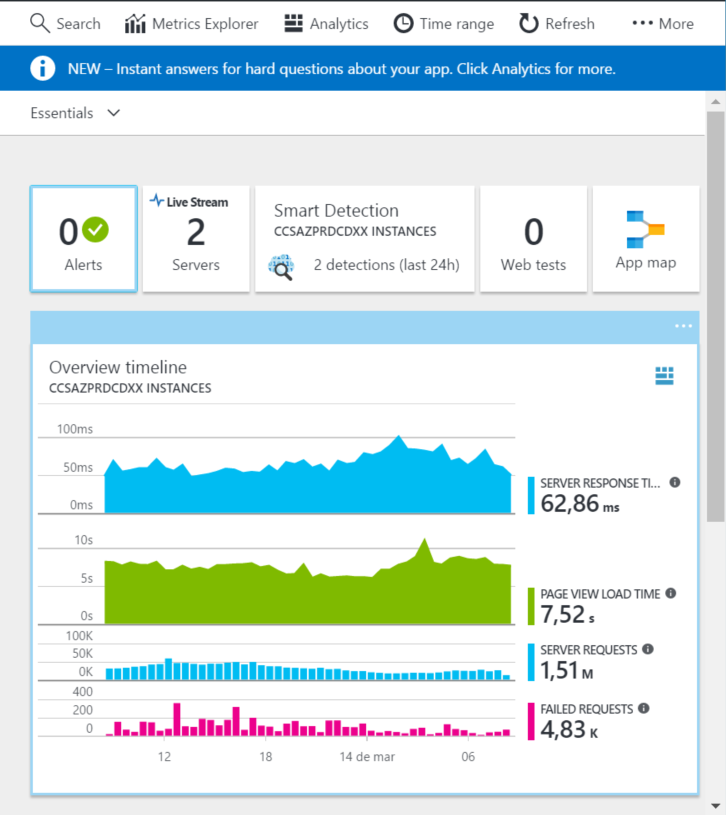
Sitecore sends what you would expect (errors, warnings, info logs) to Application Insights from a log perspective, but Application Insights telemetry will also let you see additional details such as:
- Server response times
- Number of server requests
- Page view load times
- Failed Requests
- Dependencies
- Windows events
- Performance counters
- Application Maps of the entire topology
Ermahgerhd… Wer er mah lerghz?
That sounds great and all, but the system administrator from our earlier example is probably just trying to find the error in the logs and figure out why the site is blowing up. How do we find the errors in the logs in this new world of insights and fancy dashboards?
The Sitecore documentation is really well done for this topic. You should read it to get the specific steps, but as a quick summary:
- Use keyword search if you have a specific error message you are looking for.
- Use Event Type filters on the search to restrict results to Trace and Exception messages.
- Use Role filters on the search to restrict results to a particular role (like CD).
- Use a Time Range filter to restrict your search to relevant days and times.
- Use a Severity level filter to filter down to Errors and Warnings
- Use the event details panel to review the message details
- Use navigation to find related messages to the selected event
Consider a scenario where a user is reporting a page is blowing up (your typical 500 error page). The system administrator would likely take the following steps:
- Ask for the page the user is viewing.
- RDP into the content delivery server.
- Navigate to the logs directory to find the log file from the date the user said they visited the site (which isn’t always the correct date).
- Open the log file in some tool (like Notepad++).
- Execute a text search on the file contents to find the error.
- If not found, repeat for any other log files from that date
- If not found, repeat for any other log files on other delivery servers.
- Once the exception is identified, the system administrator then looks at the log entries immediately following and preceding to see any indication of the cause of the error.
In an Application Insights world, the flow is very similar, except we can eliminate some of the painful steps.
- Log into Application Insights
- Apply a ‘role’ filter for CD to pull the events from all delivery instances
- Filter by event types Trace and Exception
- Filter by Severity options for Errors and Warnings
- Apply a Time Range filter based on when the user said they saw the error. Open up your span a little bit on either side to allow for user memory error.
- Scan the events for something relevant and select the event to view details.
- Navigate to related messages to look for an indication of the cause of the error.
As you can see, it is a similar approach, but your multi-server setup is much easier to handle and you don’t need to have remote access to the server to do this. This is great if you want the developers investigating the issue instead of the system administrator. Hello DevOps improvement!
I don’t always use telemetry, but when I do…
Application Insights isn’t just for Sitecore. With its free option (1GB per month) you can tie this to pretty much anything you have running. Just follow these instructions for your .NET web application and you’ll be up and running with this advanced analytics platform in no time!
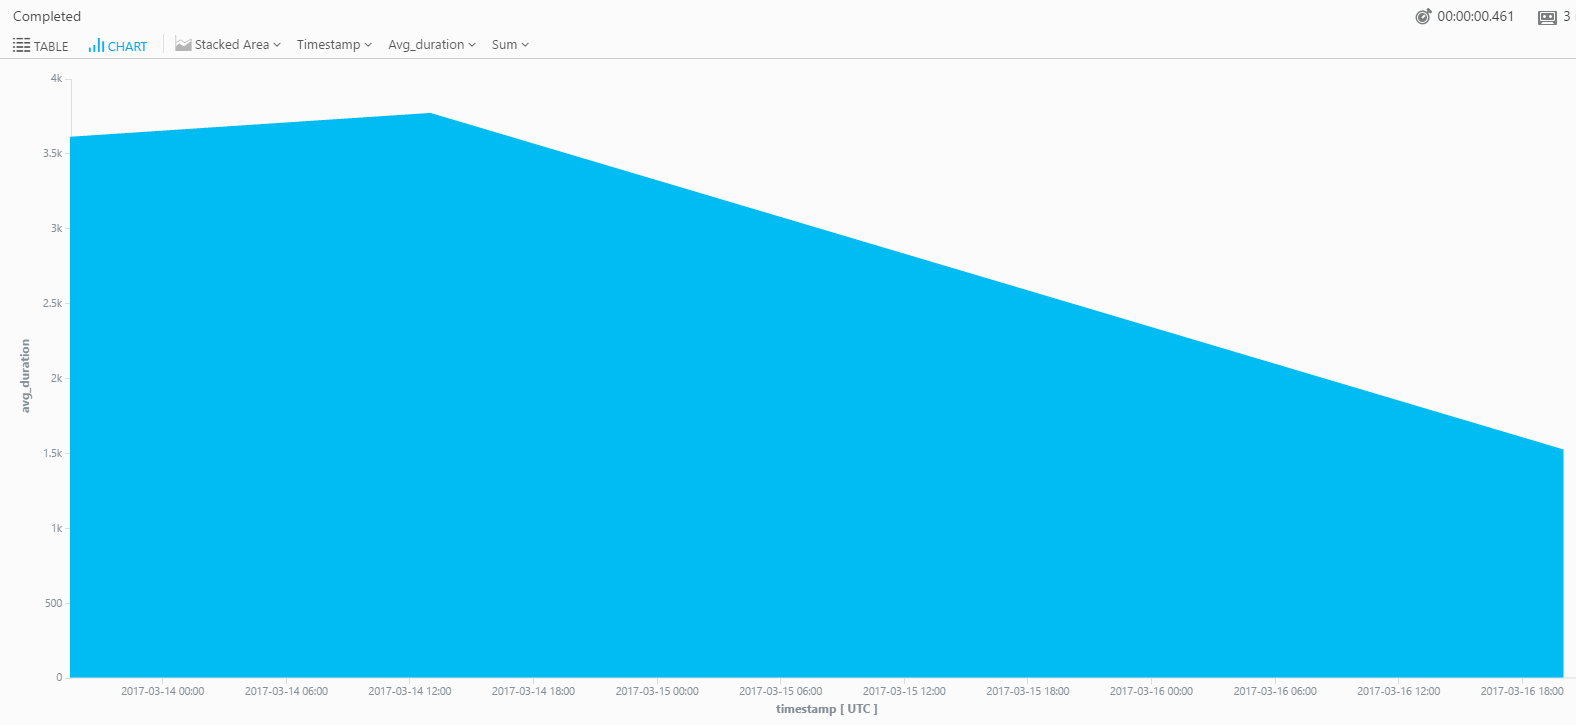
Below is an example report from a simple MVC web application I run internally on the Nonlinear network to offer automation services to the team. I added application insights telemetry configuration, deployed, and can immediately view data. The graph shows average response times over a span of time (in this case about 3 days of data). Effort to plug it in? Less than 30 minutes end to end. That includes the time I had to read up on how to do it AND the time taken to do the deployment.
CAUTION: The free version of Application Insights has a usage limit of 1GB after which you pay. However, the telemetry gathering caps for Application Insights are not altered in any way when you select the free version. Make sure to go in and cap your daily usage so you don’t accidentally start getting charged before you are ready.
Setting a daily cap:
- Log into the Azure Portal
- Access your Application Insights Resource
- On the left side, in the ‘Configure’ group, select “Features + pricing”
- Ensure you have “Application Insights Basic” selected as the plan
- At the top, select “Daily cap”
- Enter in a daily limit value.
Some related reading before you go
- Sitecore: Analyze Sitecore logs with Application Insights
- Microsoft: What is Application Insights?
- Microsoft: Set up Application Insights for your ASP.NET website
- Johannes Zijlstra: Application Insights for Sitecore (or, where have my logfiles gone?)
- Rohit Chopra: How to take benefit from Application Insights for Sitecore on Azure Web Apps?


